The Serving Size Problem — Why Your Calorie Comparisons Are Wrong
Here's a scenario most shoppers have encountered without realizing it: you pick up two competing protein bars. Bar A shows 200 calories per serving. Bar B shows 250 calories per serving. You reach for Bar A without a second thought — it has fewer calories, so it must be the better choice, right?
Not necessarily. Bar A's serving size is 40g. Bar B's serving size is 55g. On a per-100g basis, Bar A has 500 calories and Bar B has 455 calories — meaning Bar B is actually the lower-calorie option when you're eating a comparable amount. Bar A just declared a smaller serving size to make its label look more favorable.
This isn't an edge case. It's a pervasive reality across packaged food categories. Serving sizes are set by manufacturers, not regulators, and they're frequently chosen to optimize how the front and back of the package look — not to reflect how people actually eat. Comparing calories between foods based on declared serving sizes can lead you to consistently make the wrong choice.
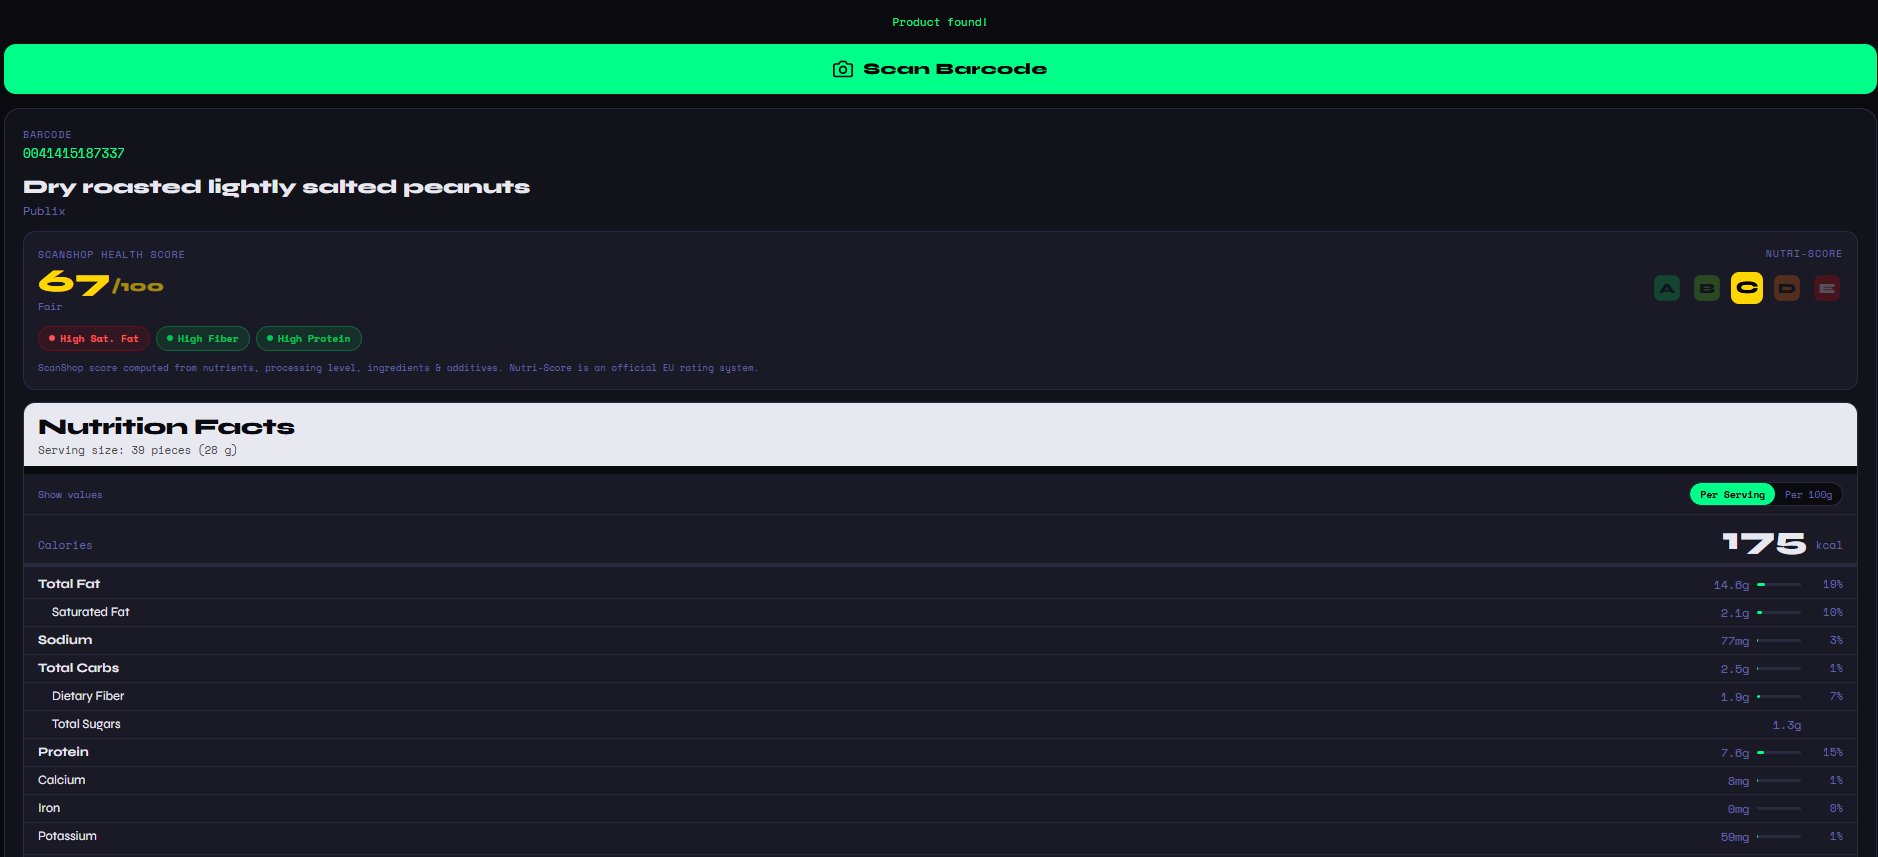
ScanShop solves this by always displaying both views: calories per serving (so you understand what one portion looks like in the context the manufacturer intended) and calories per 100g (so your comparisons between products are always fair and normalized). You can toggle between them directly in the nutrition view.
Per-100g is the international standard for food labeling comparison, used in EU nutrition labeling law. It's the only reliable way to compare calorie density across products with different serving sizes. ScanShop shows it by default in comparison mode.
Per-Serving vs. Per-100g: A Real Example
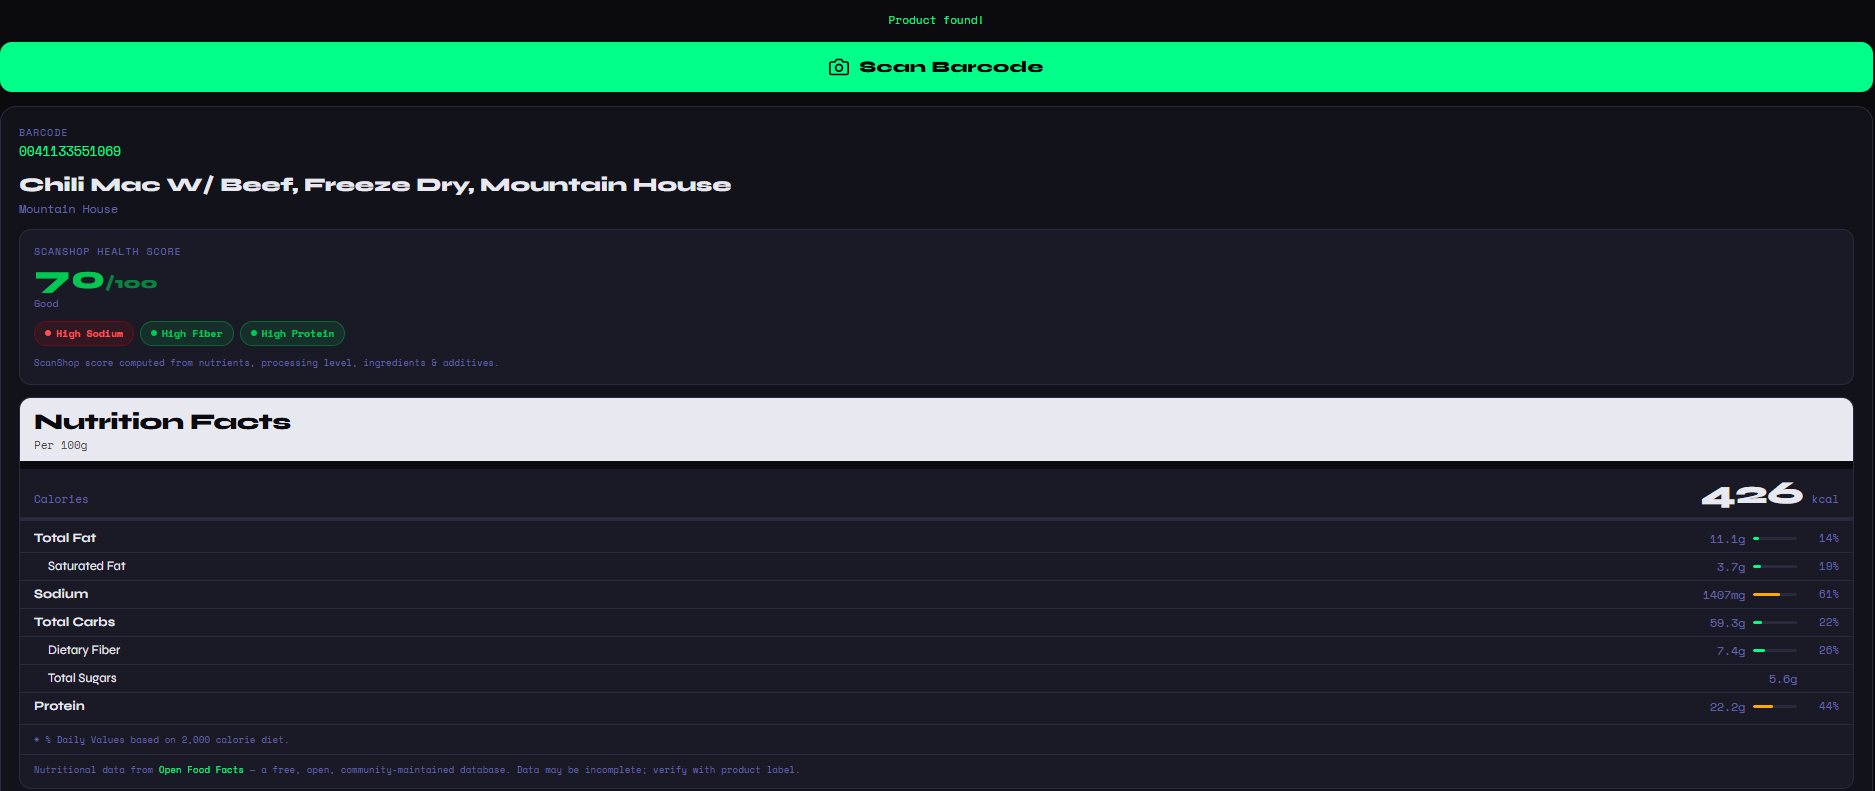
Look at the Mountain House Chili Mac shown in ScanShop above. The nutrition label is displayed per 100g, showing 426 kcal. Now compare that to a competing freeze-dried meal that declares 190 calories per serving on its label — sounds much lower at first glance. But if that serving is 40g, then per 100g it's actually 475 calories — higher than the Chili Mac.
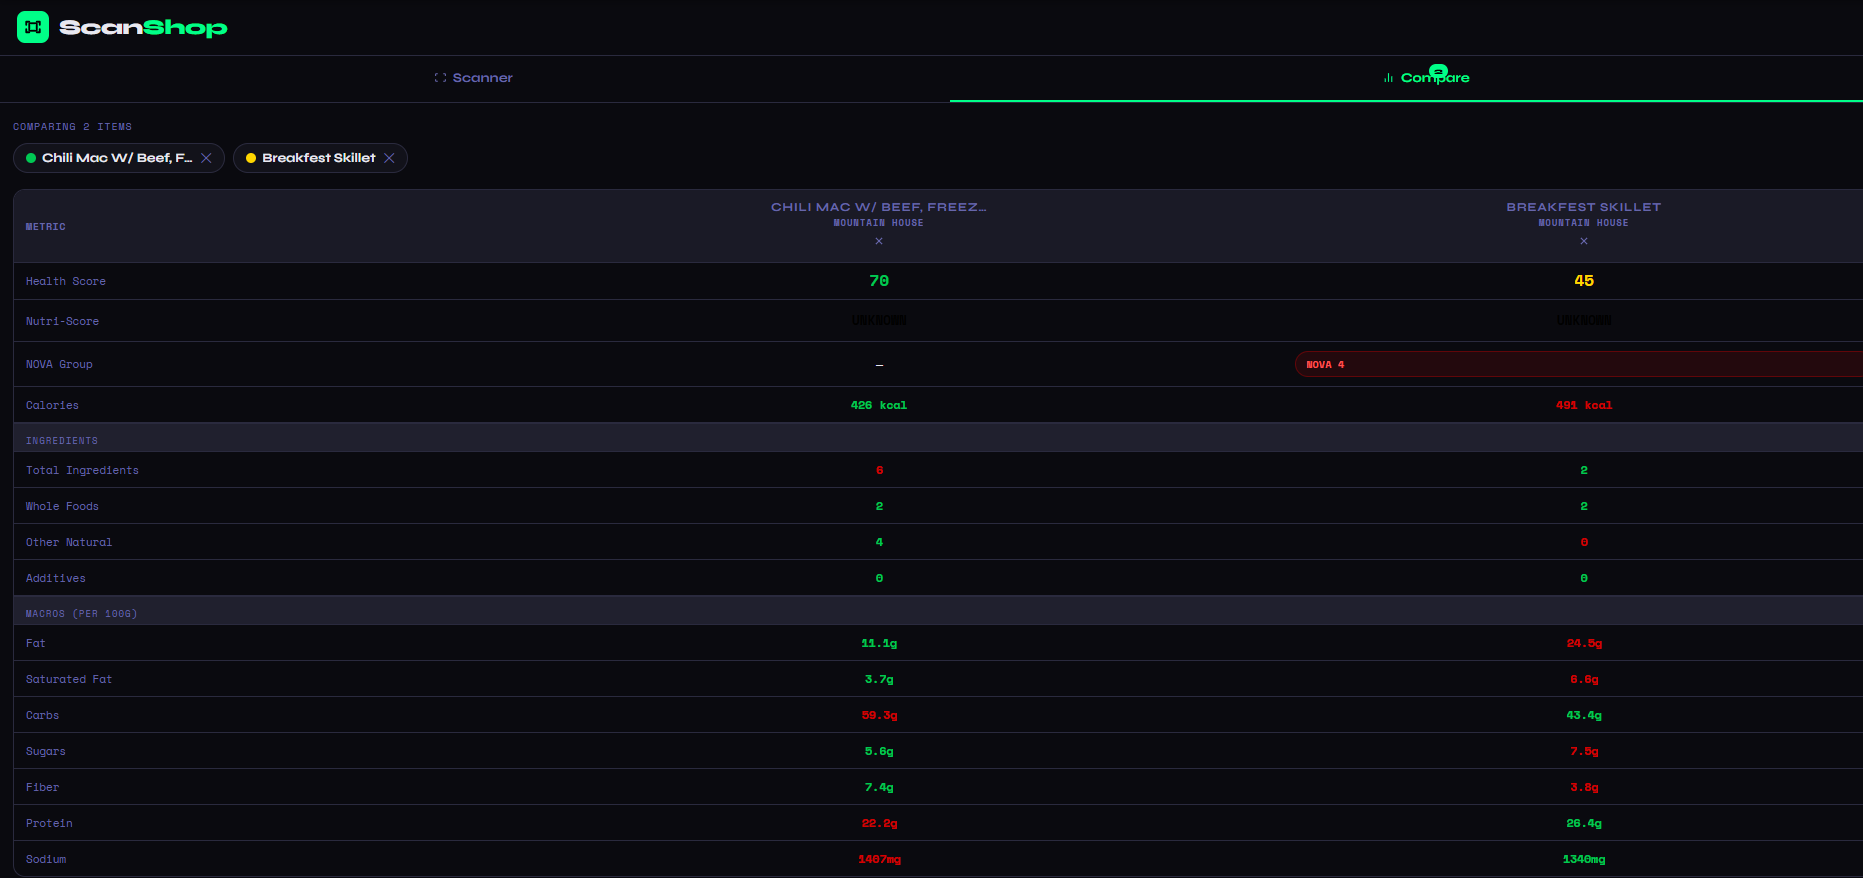
In the comparison view, ScanShop eliminates this confusion entirely. Both products are shown in the same per-100g basis, making it impossible to be misled by serving size manipulation. The calorie row is color-coded — green for the lower-calorie product, red for the higher — so the winner is instantly visible without any calculation on your part.
| Metric | Chili Mac W/ Beef | Breakfest Skillet |
|---|---|---|
| Calories (per 100g) | 426 kcal | 401 kcal |
| Health Score | 70 / Good | 45 / Poor |
| Fat (per 100g) | 11.1g | 24.5g |
| Protein (per 100g) | 22.8g | 26.4g |
| Fiber (per 100g) | 7.4g | 3.8g |
| NOVA Group | — | NOVA 4 |
The Breakfest Skillet is 25 calories per 100g lower than the Chili Mac. But it carries more than double the fat, significantly less fiber, and a NOVA 4 ultra-processed classification. The lower calorie count is not the whole story — and without the full comparison, it's potentially a misleading one.
Why Calories Alone Are a Poor Metric for Food Quality
The calorie is a unit of energy. It tells you nothing about where that energy comes from, how efficiently your body uses it, or what else the food delivers alongside it. Two foods with identical calorie counts can have radically different effects on satiety, metabolic response, gut health, and long-term nutritional outcomes.
A food engineered to be low-calorie often achieves that by replacing fat with added sugars, or by using bulking agents and artificial sweeteners. Lower calories can come with worse ingredients and a more processed product.
Nuts, seeds, olive oil, avocado, and whole grains are all calorie-dense but nutritionally valuable. A handful of almonds has more calories than a bag of rice cakes but delivers far more nutrition per calorie.
Serving sizes are manufacturer-defined and vary wildly across competing products. Two competing cereals might declare 30g and 45g servings respectively, making direct calorie comparison completely unreliable without normalization.
Calorie Quality — What ScanShop Adds Beyond the Number
ScanShop's approach is to give you the accurate calorie number (per-100g) and then contextualize it with everything else that matters. The Health Score tells you whether those calories are coming from nutritious sources or processed filler. The macro breakdown tells you how those calories are distributed across fat, protein, and carbohydrates. The fiber and protein numbers tell you how filling those calories are likely to be. And the NOVA group tells you how industrially manufactured the product is.
This is what real calorie comparison looks like: not just the number, but what's behind it. A 400-calorie product that's high in protein, fiber, and whole-food ingredients is a fundamentally different food from a 400-calorie product made primarily of refined carbohydrates, added sugars, and industrial additives — even though they look identical on a basic calorie comparison.
Ready to put it into practice? Open ScanShop, scan two products you're deciding between, and let the per-100g comparison table settle it. Or read our guides on comparing nutrition facts, comparing two food products head-to-head, and which food is healthier for the full picture on making smarter grocery decisions.
ScanShop is completely free and requires no account. Open it in any browser, scan any UPC or EAN barcode with your phone's camera, and get per-100g calorie data, full macros, a health score, and an ingredient breakdown in under five seconds.