Why Comparing Nutrition Facts Matters More Than You Think
At first glance, two products can look nearly identical on the shelf — same category, similar price, comparable packaging. But a closer look at their nutrition labels often tells a very different story. One might have three times the sodium of the other. One might list whole foods as primary ingredients while the other packs in additives and preservatives you can't pronounce. Without a side-by-side comparison, you're flying blind every time you shop.
The problem is that comparing nutrition facts manually is tedious. You pick up the first box, scan the label, mentally note the numbers, set it down, pick up the second, and try to remember what the first one said. By the time you're weighing protein against saturated fat against fiber against sodium, you've spent five minutes in the cereal aisle and you're still not sure which one to buy.
ScanShop was built specifically to eliminate that friction. It's a free, browser-based food barcode scanner that lets you scan two products and instantly places every nutrient head-to-head in a clean, color-coded comparison table — no app download, no account, no subscription required.
ScanShop's comparison view covers everything — Health Score, Nutri-Score, NOVA processing group, calories, total fat, saturated fat, carbs, sugars, fiber, protein, sodium, and full ingredient breakdowns. Color coding shows the winner in each category at a glance.
What the Comparison View Shows You
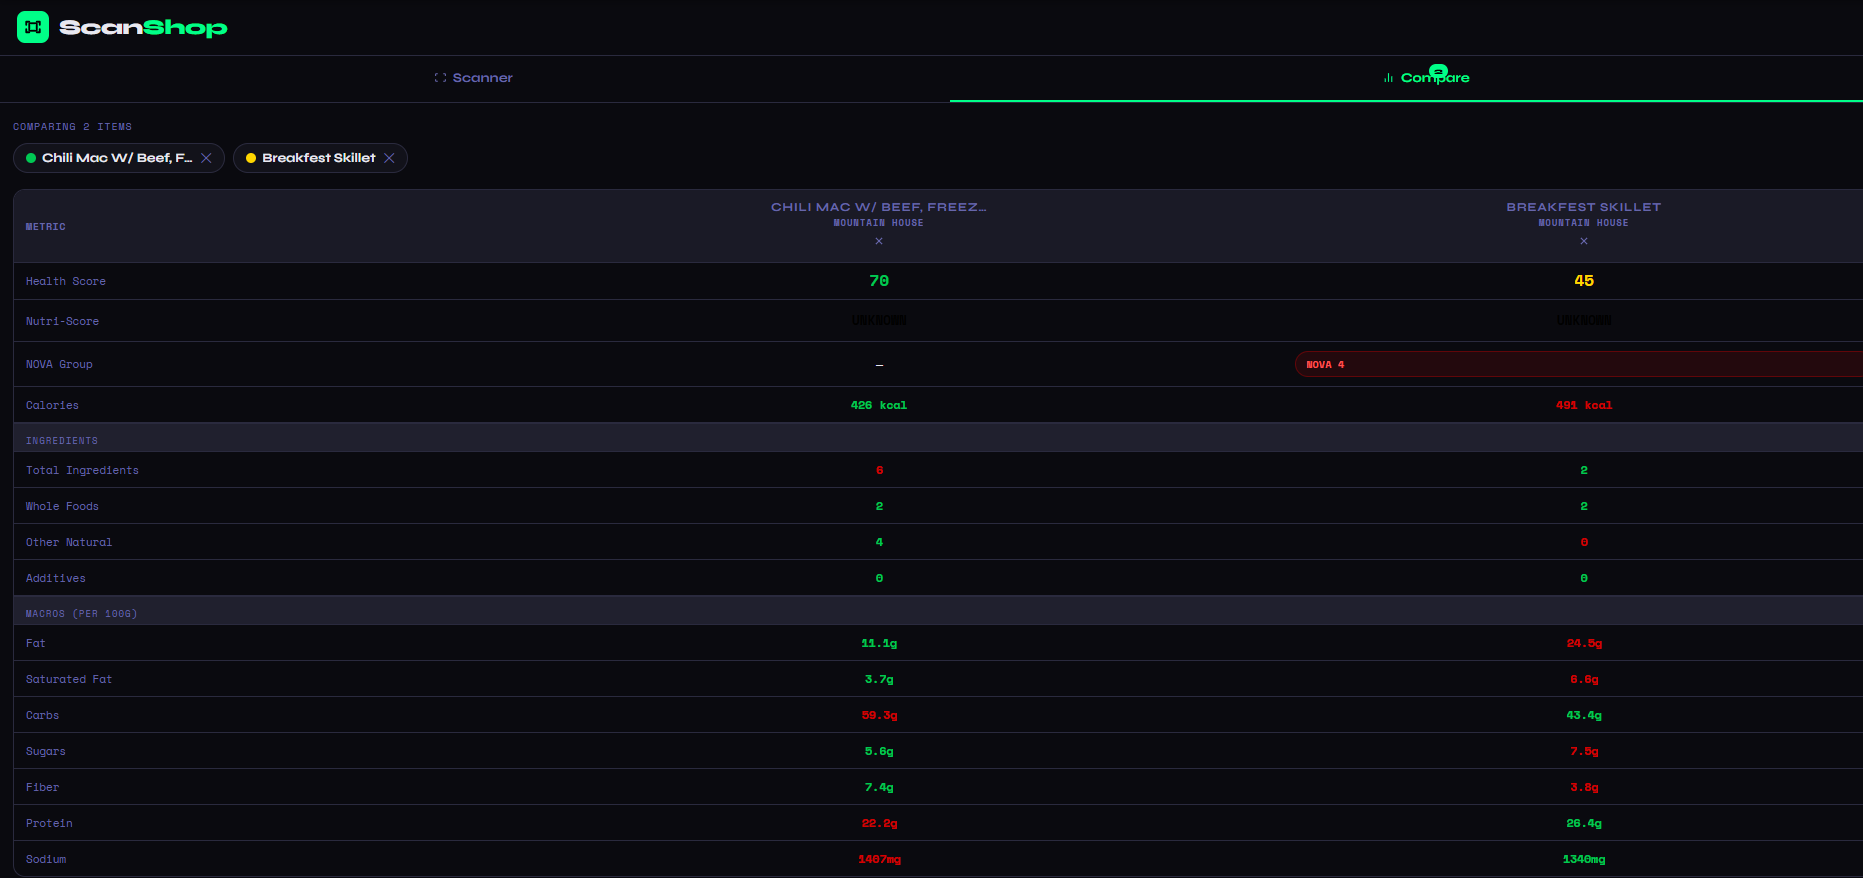
When you add a second product in ScanShop, the interface switches to a two-column comparison table. Each row represents one nutritional metric, and the values are color-coded green or red to indicate which product performs better in that category. You don't need to do any mental math — the tool does it for you.
The comparison starts at the top with the big-picture scores: the ScanShop Health Score (a 0–100 rating that weighs nutrients, processing level, additives, and ingredient quality) and the EU Nutri-Score (the official A–E grade used across Europe). These give you an immediate sense of which product is the better overall choice before you even get into the individual macros.
Below the scores, ScanShop displays the NOVA processing group for each product. NOVA is a scientific food classification system that categorizes products from Group 1 (unprocessed whole foods) to Group 4 (ultra-processed). A product flagged as NOVA 4 is a significant signal that it contains industrial formulations, additives, and processing aids beyond what you'd find in a home kitchen — something that's invisible on a standard nutrition label but critically important for long-term health decisions.
The macros section then breaks down fat, saturated fat, carbohydrates, sugars, fiber, protein, and sodium — all normalized per 100g so the comparison is always apples-to-apples regardless of different serving sizes. This is an important detail: a product with a larger serving size can appear to have more protein simply because you're eating more of it, not because it's more nutrient-dense. Per-100g comparison removes that distortion entirely.
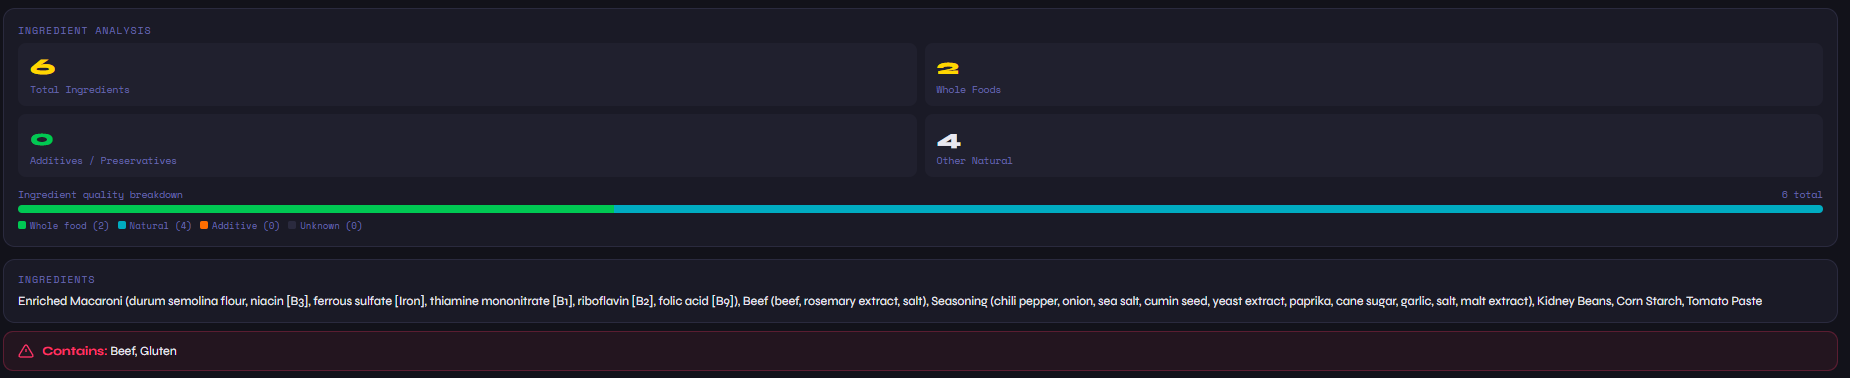
Finally, the ingredients section shows total ingredient count, whole food count, other natural ingredients, and additives for each product side by side. If you're trying to choose the less processed option, this section makes the answer immediately obvious.
How to Compare Two Products in ScanShop
Open ScanShop and Scan Your First Product
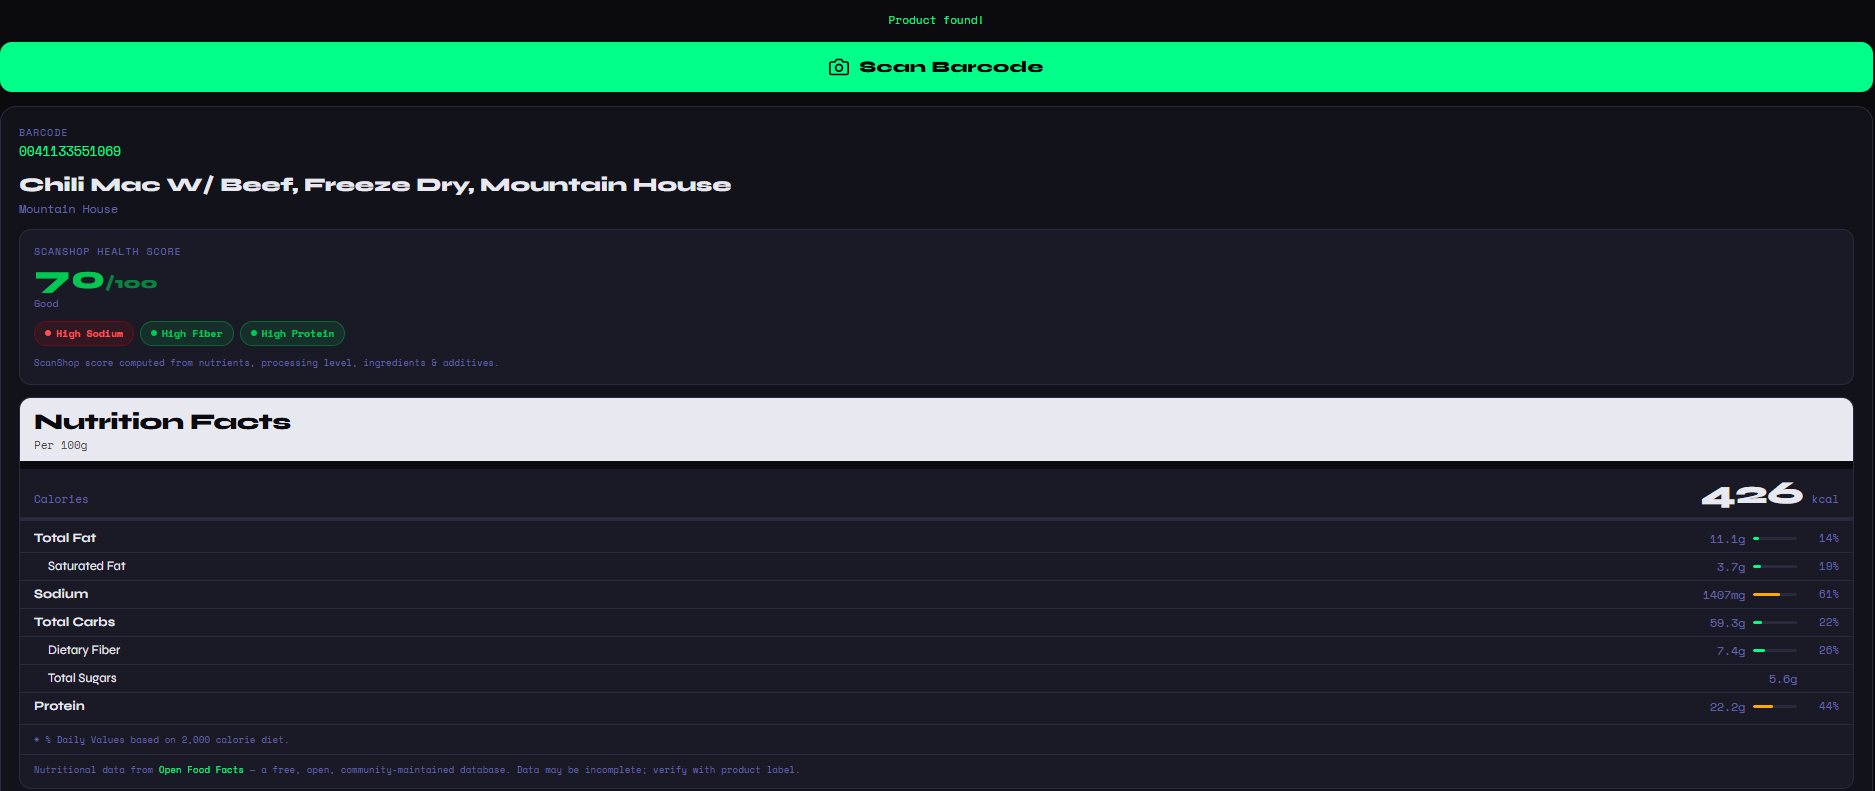
Head to barcode-scanner.html on any smartphone or desktop browser. Tap "Scan Barcode" and aim your camera at the first product's UPC or EAN barcode. ScanShop will identify the product and load its full nutrition data instantly.
Tap "Add to Compare"
Once the first product loads, you'll see an "+ Add to Compare" button below the results. Tap it to queue that product, then scan the second barcode. ScanShop saves your first scan and switches to comparison mode automatically.
Read the Side-by-Side Breakdown
The comparison table populates immediately. Green highlights the better value in each row; red flags the weaker one. Scroll through Health Score, Nutri-Score, NOVA group, all macros, and ingredient quality metrics to make a fully informed choice.
Real Example: Chili Mac vs. Breakfest Skillet
Take the screenshot above — both products are from Mountain House, both are freeze-dried backpacking meals, and both sit in the same product category. But the comparison reveals meaningful differences. The Chili Mac scores a 70 (Good) on ScanShop's Health Score; the Breakfest Skillet scores a 45. The Breakfest Skillet is flagged as NOVA Group 4 — ultra-processed — while the Chili Mac has no NOVA classification at that level. The Chili Mac has 6 total ingredients vs. 2 for the Skillet, but a higher proportion of whole and natural ingredients.
In terms of macros per 100g, the Chili Mac has more fat (11.1g vs 24.5g) — wait, that's the Skillet with significantly more fat. The Chili Mac also wins on fiber (7.4g vs 3.8g) while the Skillet has slightly more protein (26.4g vs 22.8g). Without ScanShop's side-by-side view, you'd need a spreadsheet to reach those conclusions. With it, the picture is clear in seconds.
Pro tip: Use the "Recently Scanned" list at the bottom of ScanShop to re-add any product to a comparison without scanning it again. Great for comparing across multiple shopping trips or building a shortlist of your go-to products.
When Nutrition Comparison Changes Your Decision
Most people assume they know which product is healthier based on marketing language — "high protein," "whole grain," "low fat," "natural." But nutrition label comparison routinely reveals surprises. A "low fat" yogurt might be loaded with added sugar to compensate for lost flavor. A "high protein" bar might get most of its calories from saturated fat. A "whole grain" bread might list enriched flour as its primary ingredient.
ScanShop's comparison tool cuts through that noise. It doesn't care what the front of the package says — it reads the actual nutrition data and ingredient list, scores both products honestly, and presents the difference clearly. That's the kind of transparency that makes a real difference in daily shopping decisions, not just for health-conscious shoppers but for anyone trying to stretch their grocery budget toward food that's actually worth buying.
Whether you're trying to figure out which food is healthier, want to compare calories between foods, or are doing a thorough head-to-head product comparison, ScanShop's free comparison tool gives you the data you need in the moment you need it — standing in the grocery aisle, phone in hand, making a decision that actually sticks.