The Problem With Comparing Packaged Foods
Walk into any grocery store and pick a category — protein bars, frozen meals, cereals, nut butters. You'll find dozens of options that all claim to be healthy, natural, high-protein, or low-sugar. The front of the package is marketing. The back of the package is data. And comparing two labels manually, while juggling the actual products, is a frustrating exercise that most people abandon halfway through.
Even when you do commit to comparing labels, serving sizes often differ, making direct calorie comparisons misleading. One brand might use a 28g serving, another a 45g serving for a product you'd eat in the same quantity. Without normalizing those numbers, you can end up choosing the product that looks better on paper simply because it declared a smaller serving size.
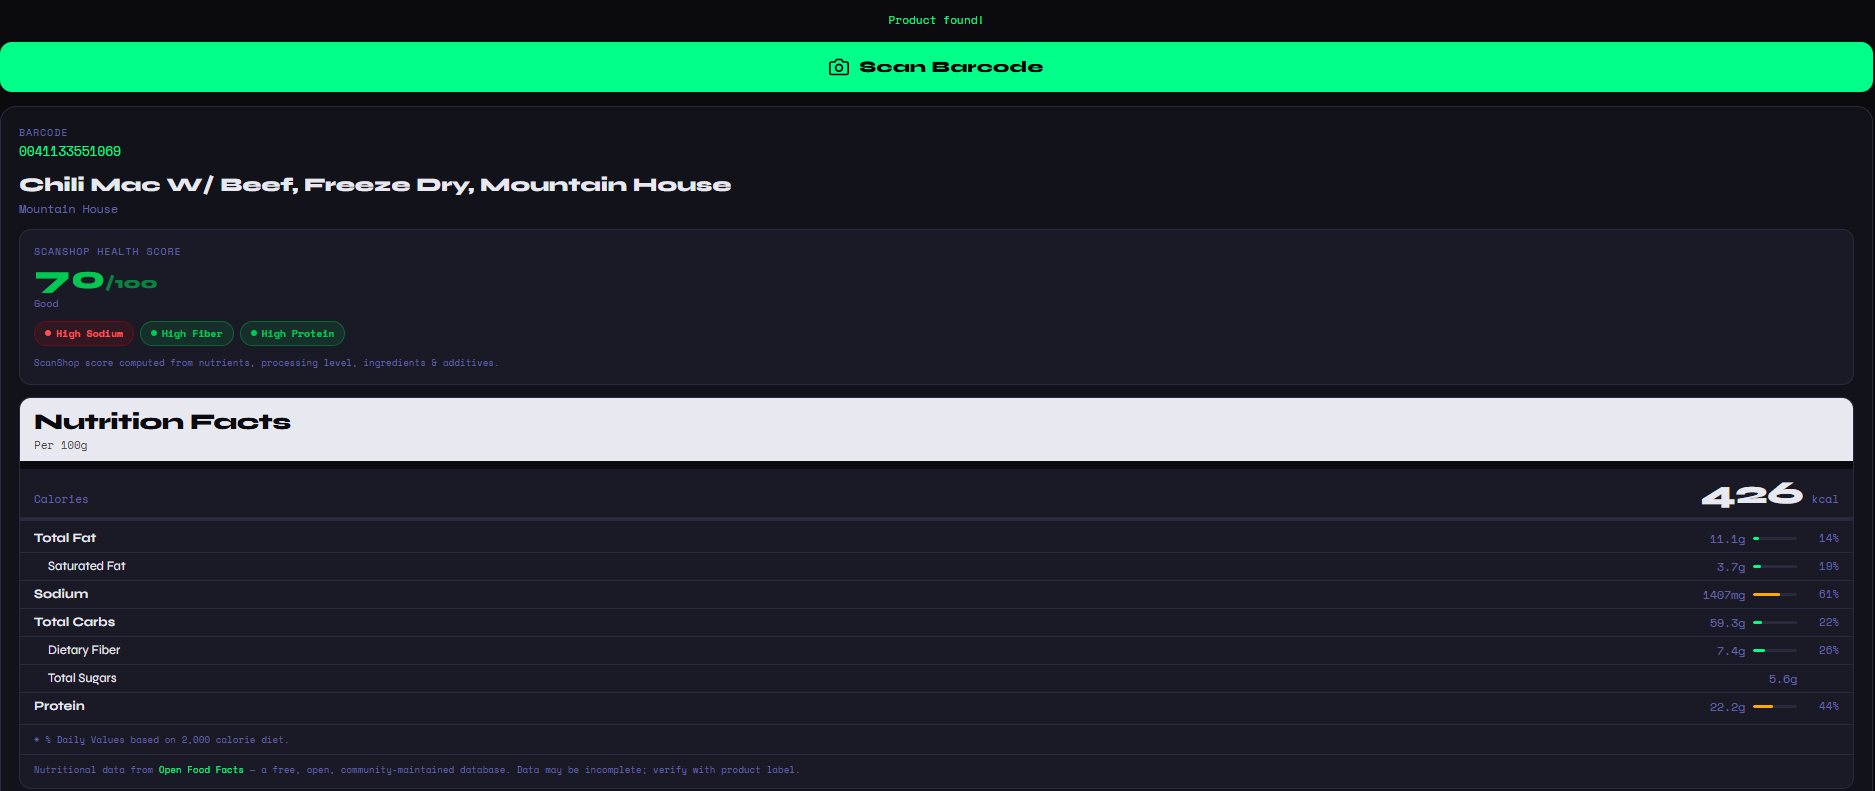
ScanShop was designed to fix exactly this. It's a free, browser-based food barcode scanner that normalizes all data to per-100g so every comparison is fair, flags the better and worse values in green and red, and goes beyond the nutrition label to score ingredient quality, processing level, and additives — all in a single view.
ScanShop works at the shelf. Open it on your phone, scan the first barcode, tap "Add to Compare," scan the second — you're done. The entire process takes under 15 seconds and requires nothing but a browser and a camera.
What ScanShop Compares Between Two Products
Health Scores
ScanShop's proprietary 0–100 score for each product, weighing nutrients, processing, additives, and ingredient quality.
Nutri-Score A–E
The official EU nutrition grade for each product — a fast, internationally recognized quality benchmark.
NOVA Processing Group
Scientific classification from 1 (unprocessed) to 4 (ultra-processed). A critical metric invisible on standard labels.
Full Macros per 100g
Fat, saturated fat, carbs, sugars, fiber, protein, and sodium — normalized per 100g for a truly fair comparison.
Ingredient Quality
Total ingredients, whole foods count, natural ingredients, and additives — side by side for both products.
Allergen Flags
Contains warnings for both products highlighted clearly, so you can spot conflicts at a glance.
Step-by-Step: How to Use ScanShop's Comparison Feature
Open ScanShop — No Sign-Up Required
Navigate to barcode-scanner.html on any device. ScanShop runs entirely in your browser — there's no app to install, no account to create, and no paywall to hit before you can start scanning.
Scan Your First Product
Tap "Scan Barcode" and point your camera at the UPC or EAN barcode on the first product. ScanShop will identify it and load the full nutrition profile — health score, Nutri-Score, macros, and ingredients — in under five seconds.
Add to Compare, Then Scan the Second
Below the first product's results, tap "+ Add to Compare." Then scan the second product's barcode. ScanShop stores your first scan and loads the second automatically, then switches the view to comparison mode.
Read the Color-Coded Results
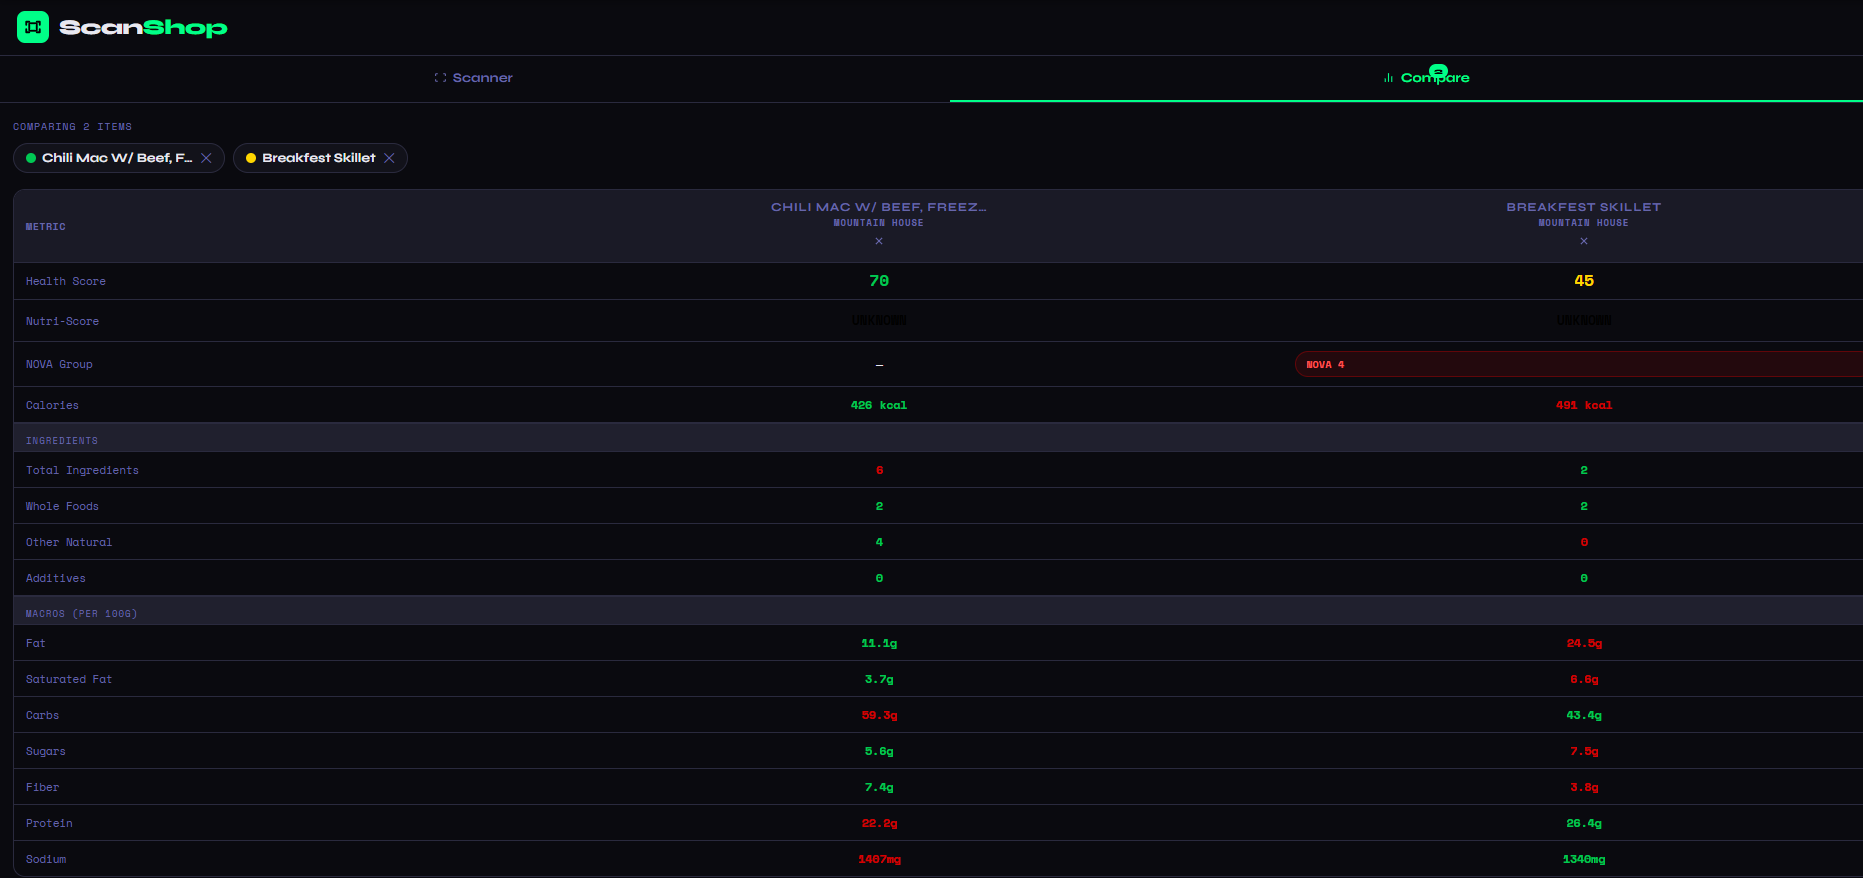
The comparison table shows both products in columns. Green values are better; red values are worse. Scroll from health scores at the top through macros and ingredient metrics at the bottom to get the full picture.
Shop the Better Product
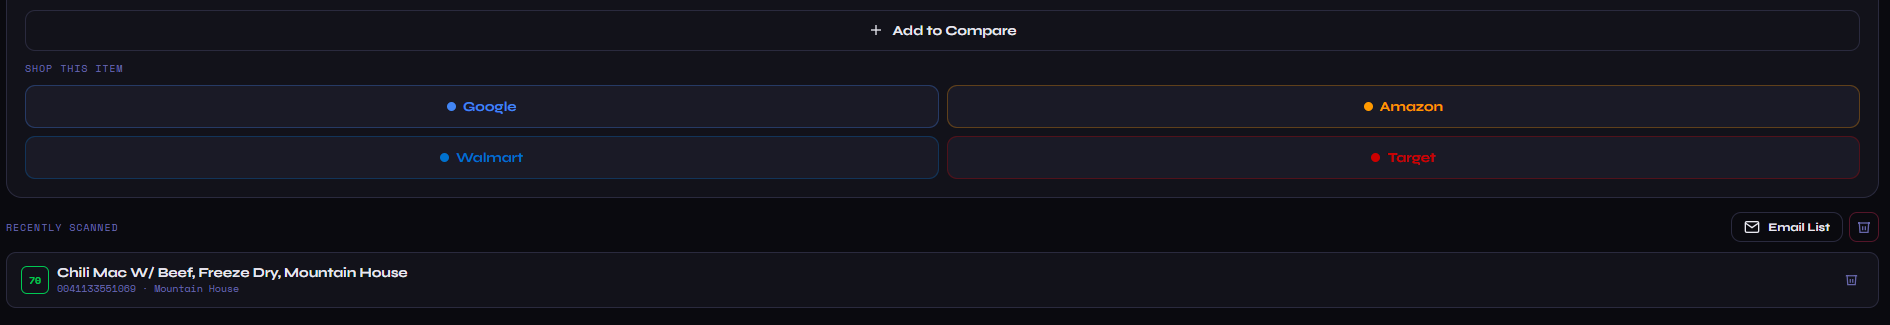
After deciding, ScanShop also shows shopping links for each product — Google, Amazon, Walmart, and Target — so you can buy the winner right from the results page.
Comparing Similar Products — Why the Details Matter
The comparison feature is most valuable when you're choosing between products that appear similar. Two brands of Greek yogurt. Two protein powders. Two "healthy" granola bars. Marketing claims across all of them might be identical, but the underlying nutrition data rarely is.
One of the most important things ScanShop surfaces in a comparison is the NOVA processing group — something you'll never find on a standard nutrition label. NOVA Group 4 products are ultra-processed, meaning they contain industrial additives, flavor enhancers, emulsifiers, and other substances not typically found in home cooking. Two products can have identical calorie and macro profiles but one might be NOVA 1 (whole food) and the other NOVA 4 (ultra-processed). That difference has significant long-term health implications that a simple calorie comparison would completely miss.
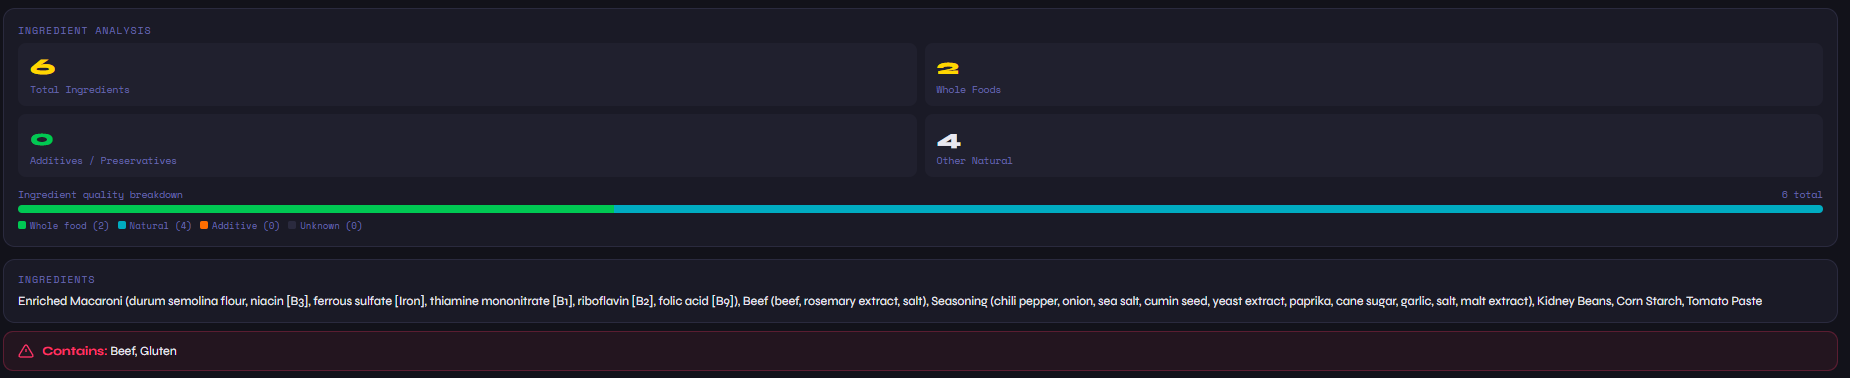
Similarly, the ingredient quality breakdown — showing whole foods vs. natural vs. additives — gives you a fast read on how processed each product is at the ingredient level. A product with 20 ingredients, most of which are additives, is a fundamentally different food than a product with 5 ingredients all of which are whole foods, even if their macro profiles are similar.
For more on understanding which product wins overall, see our guide on which food is healthier, or dive into the specifics of comparing calories between foods. You can also read our full guide on comparing nutrition facts to understand how ScanShop scores each metric.
Email your scan history to yourself using ScanShop's "Email List" feature. Great for keeping a reference of products you've already vetted, or sharing your grocery research with a partner.
The Shop This Item Feature
Once you've done your comparison and chosen the better product, ScanShop makes it easy to go buy it. Each scanned product includes a "Shop This Item" section with quick links to search for it on Google Shopping, Amazon, Walmart, and Target. This is especially useful for stocking up on a product you discovered at one store but want to find at a better price elsewhere, or for ordering online when you can't find something locally.
The recently scanned list at the bottom of ScanShop also persists your history so you can revisit products from previous shopping trips without scanning again — useful for building a curated list of your best-rated staple foods over time.