Why "Healthy" Is Harder to Define Than It Looks
Ask ten nutritionists which food is healthier and you'll get ten different answers depending on the context — your goals, your dietary restrictions, your health conditions, and what metrics they weight most heavily. That ambiguity is real. But it doesn't mean you should give up on the question. It means you need better tools to answer it.
The fundamental problem with judging food health is that people tend to anchor on a single number — usually calories. A "low calorie" food is assumed to be healthy; a "high calorie" food is assumed to be bad. But that framework misses nearly everything that matters: fiber content, saturated fat vs. unsaturated fat, sodium levels, sugar type (natural vs. added), protein density, ingredient processing level, and the presence of additives that can affect gut health, inflammation, and long-term risk factors.
ScanShop was built to answer the "which food is healthier" question with data, not guesswork. When you scan any packaged food's barcode, ScanShop pulls the full nutrition profile from a database of over 2 million products and runs it through a multi-factor scoring algorithm that considers all of those dimensions — not just calories.
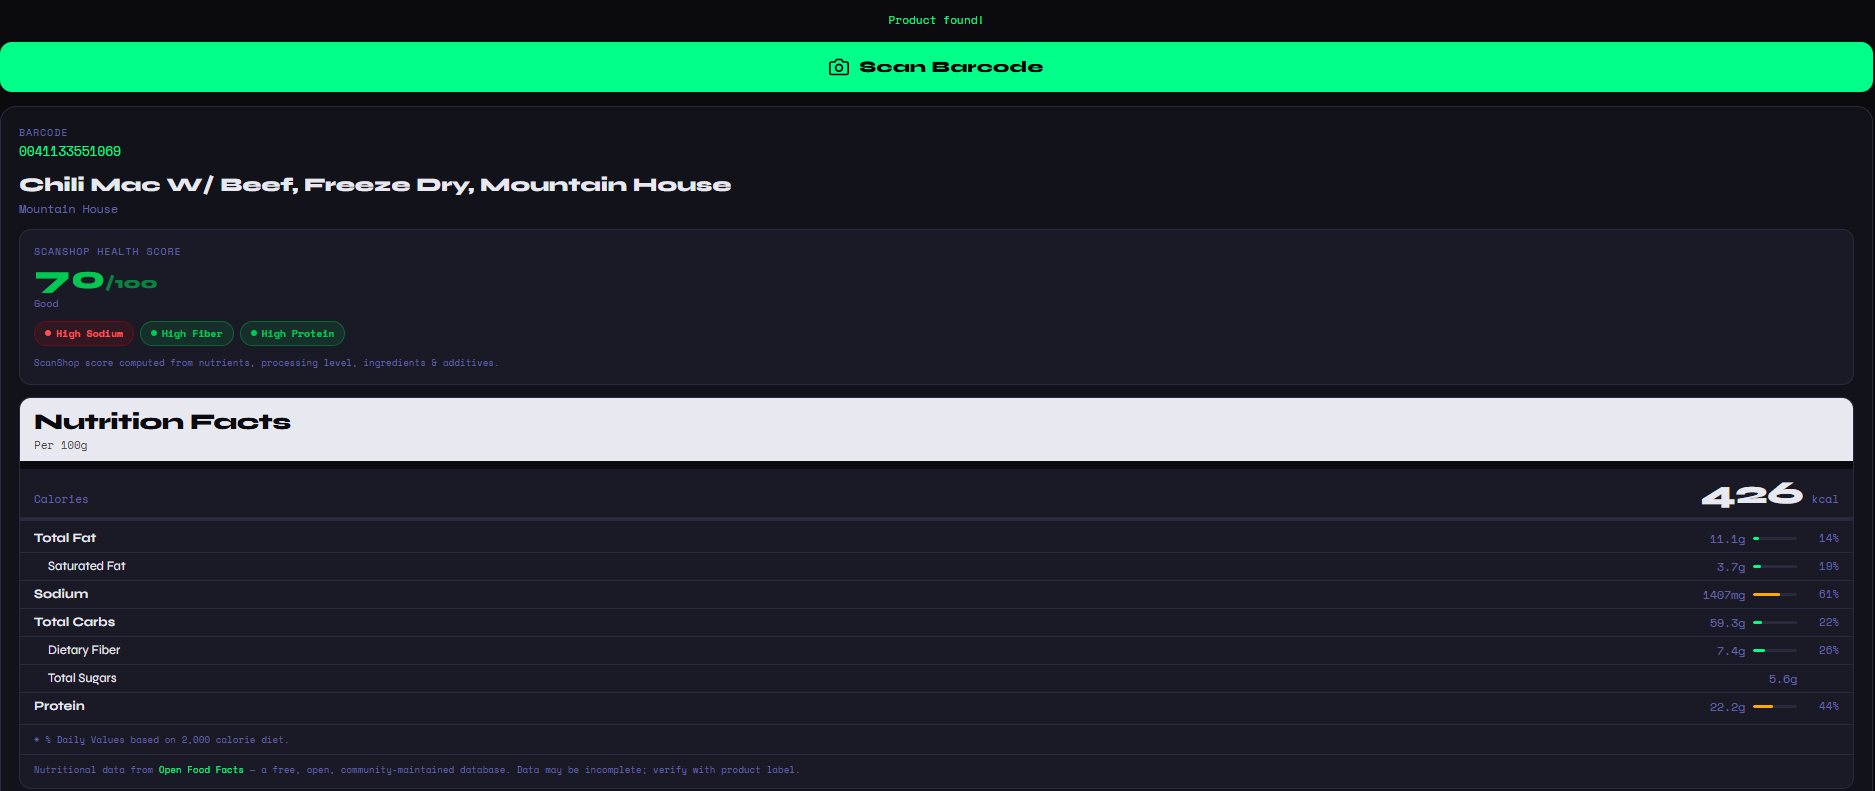
The ScanShop Health Score (0–100) is computed from nutrient density, processing level, ingredient quality, and additive presence. It's designed to reflect the kind of nuanced analysis a nutritionist would apply — condensed into a single, actionable number.
Understanding the ScanShop Health Score
Every product scanned in ScanShop receives a Health Score between 0 and 100. Here's what the ranges mean in practice:
Below the score, ScanShop displays colored flag pills that explain what drove it — labels like "High Sat. Fat," "High Fiber," "High Protein," "High Sodium," or "Ultra-Processed." These flags make the score transparent rather than opaque: you're not just getting a number, you're getting a breakdown of why.
The Four Signals That Determine Food Health
ScanShop's health evaluation draws on four primary signal categories that research consistently links to food quality and long-term health outcomes:
Nutrient Density
How many beneficial nutrients (protein, fiber, vitamins, minerals) does the food deliver per calorie? High nutrient density is the foundation of a healthy product.
Processing Level
NOVA classification (1–4) tells you how industrially processed a food is. Ultra-processed foods (NOVA 4) are strongly linked to negative health outcomes regardless of their macro profile.
Ingredient Quality
Whole foods and natural ingredients score higher than synthetic additives, flavor enhancers, and preservatives. ScanShop counts and categorizes every ingredient.
Red Flag Nutrients
Saturated fat, sodium, and added sugars above certain thresholds are flagged as concerns, consistent with major dietary guidelines.
What the Nutri-Score Adds to the Picture
ScanShop also displays the EU Nutri-Score — an official A-to-E food quality grade developed by European public health agencies and adopted by major international food brands. The Nutri-Score uses a points-based algorithm that rewards protein, fiber, fruits, vegetables, and legumes while penalizing saturated fat, sodium, sugar, and calories.
The Nutri-Score gives you a fast, internationally recognized benchmark to compare against. A product scoring Nutri-Score A is genuinely better nutritionally than a Nutri-Score C product in the same category. And seeing both the Nutri-Score and the ScanShop Health Score together gives you two independent analyses — catching cases where one metric might be misleading without the other.
For example, a high-fat product like olive oil or nuts might score Nutri-Score C because the algorithm penalizes fat regardless of type. But the ScanShop Health Score, which accounts for ingredient quality and nutritional context, might rate the same product significantly higher. Having both perspectives is more valuable than either alone.
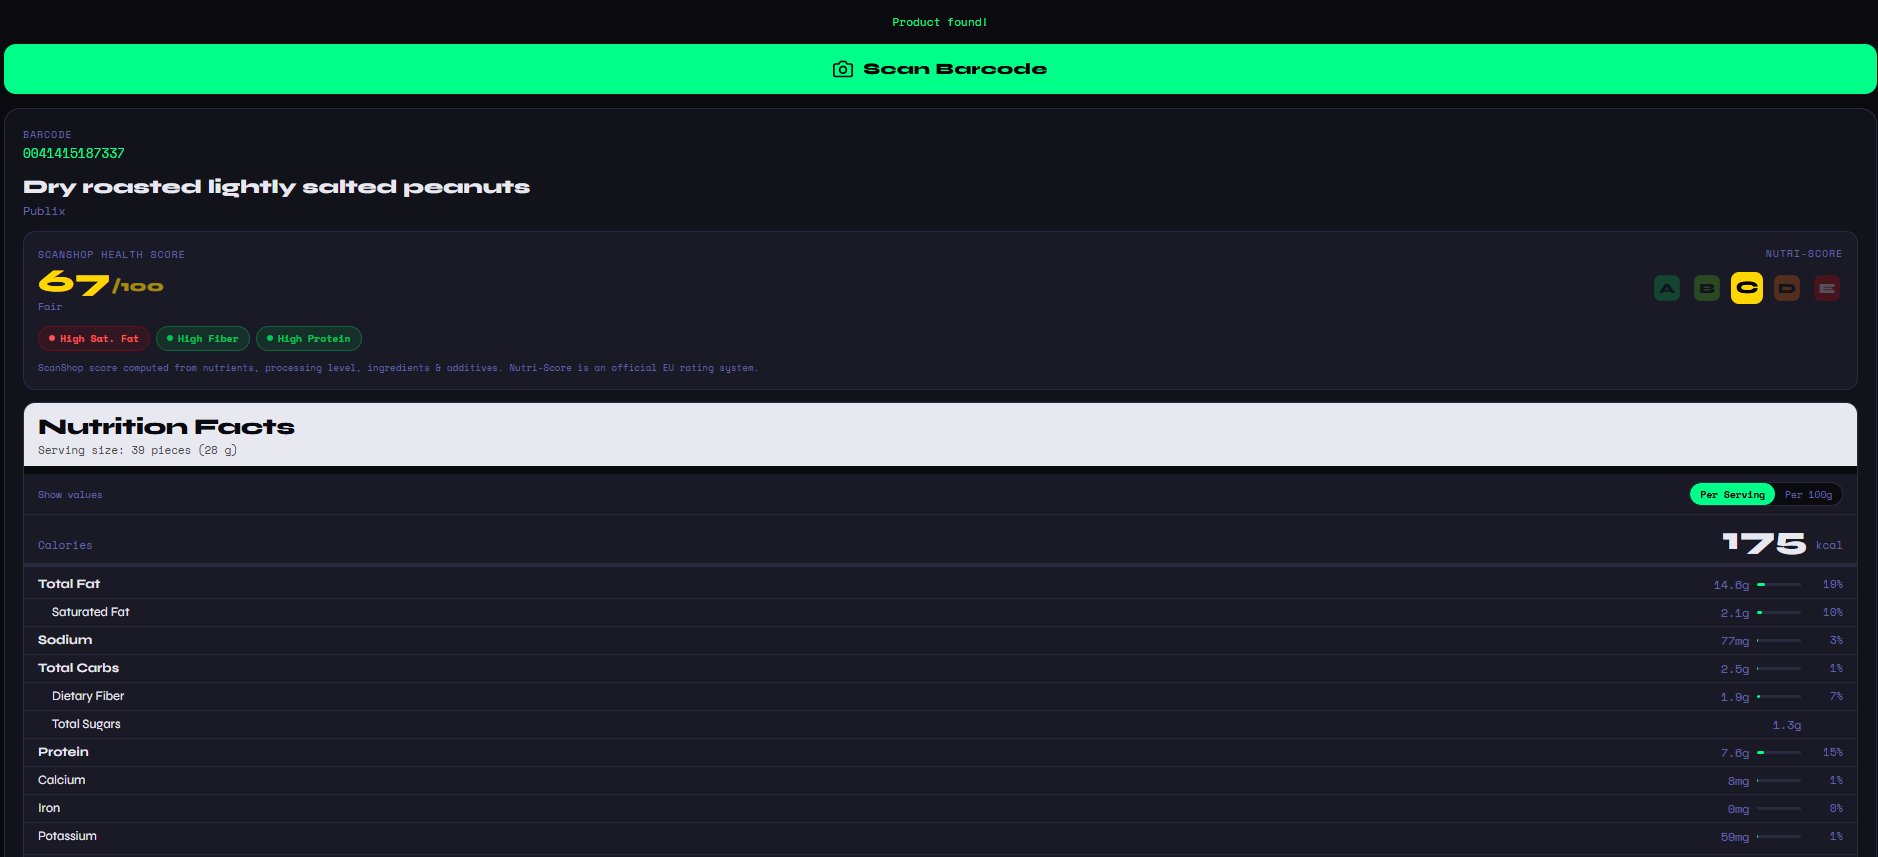
Real Example: Peanuts — Healthier Than They Appear?
The screenshot above shows Publix Dry Roasted Lightly Salted Peanuts scanning in at a ScanShop Health Score of 67 — rated Fair. The flags show High Sat. Fat, High Fiber, and High Protein. The Nutri-Score comes back as C.
Is that good or bad? It depends on what you're optimizing for. If you're concerned about saturated fat intake, the flag is relevant. But if you're looking for a high-protein, high-fiber snack with no additives and a short, whole-food ingredient list, this product performs well. The score reflects the trade-off honestly — and the flags tell you exactly what to weigh in your own context.
That's the value of a multi-dimensional health assessment over a single-number judgment. Compare this to a "low fat" rice cracker with a long ingredient list full of additives: the cracker might appear healthier at first glance (lower fat, lower calories) but could score lower on ScanShop due to higher processing level and zero nutritional density.
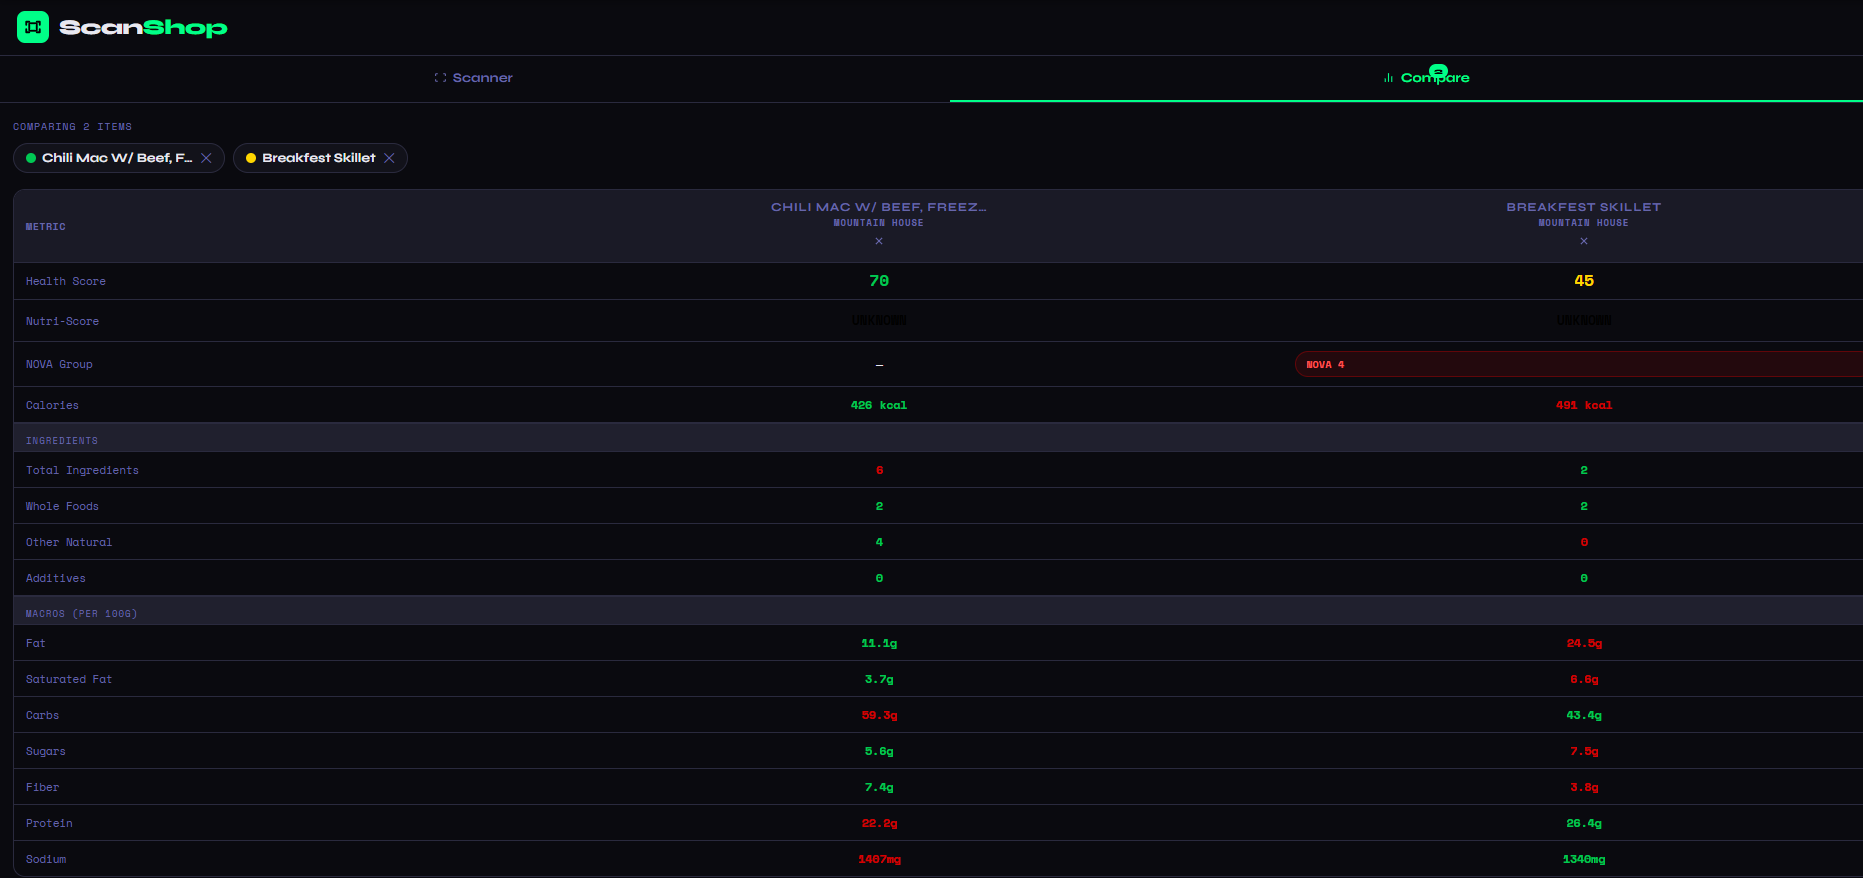
Want to put products head to head? Use ScanShop's product comparison feature to scan both and see the full analysis side by side. You can also compare nutrition facts in detail, or specifically compare calories between foods using a fair per-100g metric.
No barcode handy? ScanShop also accepts manual barcode entry — just type in the UPC number and get the full health analysis without needing the physical product in front of you. Useful for researching products before you go shopping.