What Is ScanShop?
ScanShop is a free, browser-based food barcode scanner built for anyone who wants to make smarter grocery decisions without downloading yet another app. Simply point your camera at any packaged food's barcode, and within seconds you'll see a detailed nutrition panel, a proprietary ScanShop Health Score out of 100, flagged ingredients, processing level, and the official EU Nutri-Score rating — all presented in one clean, easy-to-read view.
Whether you're tracking macros, managing a health condition, trying to cut back on saturated fat, or just curious what's actually in your food, ScanShop's free barcode scanner gives you the transparent, unfiltered data you deserve. No paywalls. No premium tiers. No account required.
ScanShop pulls from a database of over 2 million products, cross-referenced with Open Food Facts and USDA data, so coverage spans major grocery chains, international brands, private-label items, and everything in between.
What Information Does a Scan Return?
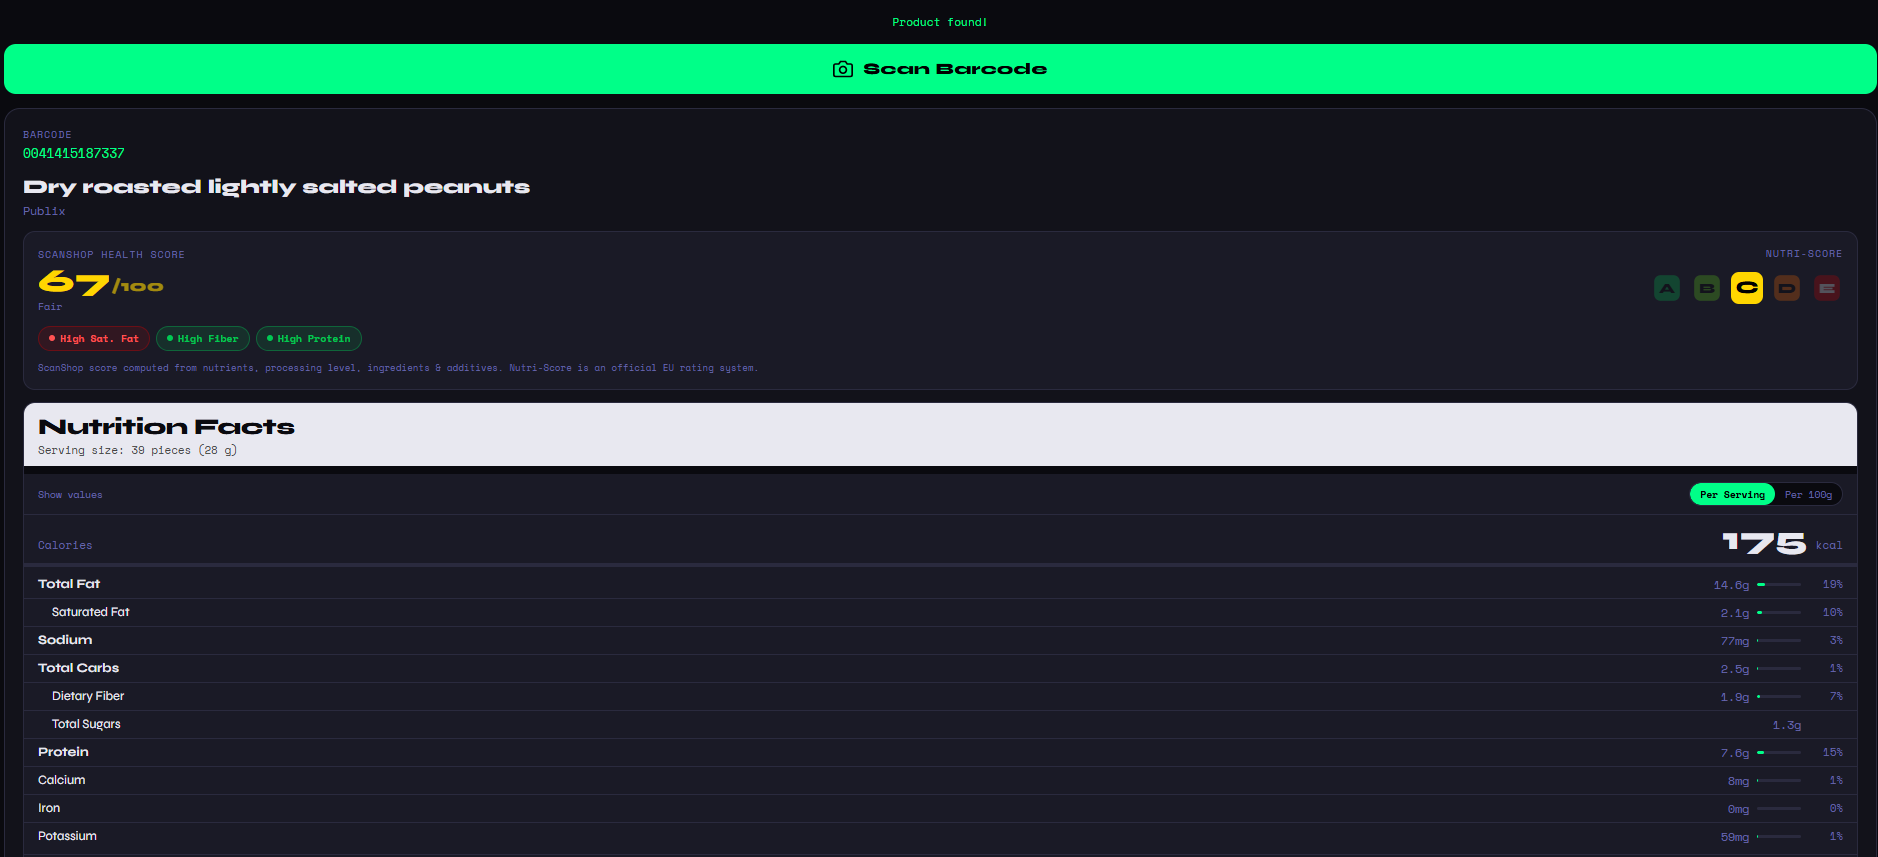
When you scan a food barcode for nutrition, ScanShop surfaces far more than just calories. Every result includes the full nutrition facts panel (per serving and per 100 g), total fat, saturated fat, sodium, total carbohydrates, dietary fiber, total sugars, protein, and key micronutrients like calcium, iron, and potassium. You'll also see the percentage of daily value for each nutrient — exactly as it appears on the physical label, but searchable and shareable anywhere.
Beyond the basics, ScanShop layers on its own analysis. The ScanShop Health Score (0–100) is computed by weighing nutrient density, processing level, additives, and ingredient quality together, giving you a single, at-a-glance signal that goes deeper than any single macro could. A score in the 80s means a genuinely wholesome product; a score in the 40s means you might want to look closer. The screenshot above shows Publix Dry Roasted Peanuts scoring a 67 — Fair — with callouts for High Sat. Fat, High Fiber, and High Protein, so you instantly understand why.
The Nutri-Score Explained
ScanShop also displays the EU Nutri-Score, an official food labeling system used across Europe that grades products from A (most nutritious) to E (least nutritious). It's the same system increasingly adopted by international food brands, and it's a powerful second opinion alongside the ScanShop score.
Having both scores side-by-side is intentional. The Nutri-Score is great for a quick benchmark, but the ScanShop Health Score digs into additives and ultra-processing that pure nutrient math misses. Together they tell a more complete story.
Free Food Barcode Lookup — No App Needed
One of the most common frustrations with nutrition apps is the friction: sign up, subscribe, install updates, and only then can you look up a product. ScanShop eliminates all of that. Our food barcode lookup runs entirely in your browser. Open the page, tap "Scan Barcode," grant camera access, and you're done. The whole process from scan to result takes under five seconds on a modern smartphone.
You can also type in a barcode number manually if you're working from a list or don't have the physical product handy — useful for comparing products before you even step into the store.
Compare Two Products Head-to-Head
Choosing between two cereals? Debating which protein bar is actually healthier? ScanShop's nutrition comparison tool lets you scan two products and place them side-by-side in a clean, color-coded breakdown. You can instantly see which food is healthier across all macros, not just one number, and even compare calories between foods on a per-serving or per-100g basis for a truly fair comparison.
The comparison view highlights the winner in each nutrient category so there's no ambiguity. Green means better, red means worse — even the most complex nutrition label becomes a clear, actionable choice.
Real-World Category Comparisons
Beyond the general comparison tool, ScanShop is perfect for settling specific product rivalries you encounter every day in the grocery store. We've put together a series of category deep-dives that walk through the nutritional data on the products most people reach for without thinking twice. Find out exactly how Coke and Pepsi stack up on nutrition — the sugar, sodium, and additive differences are real even if the calories look similar. Or dig into the oat milk brand comparison and discover why calorie and additive counts vary dramatically across Oatly, Califia, Planet Oat, and store brands.
If you grab a protein bar as a daily snack, our protein bar nutrition breakdown reveals what's really behind claims like "low sugar" and "natural ingredients" — from the clean whole-food label of RXBar to the high-protein but heavily processed Quest Bar. And for the category with possibly the most misleading health marketing in the entire store, our breakfast cereal comparison shows which boxes are actually nutritious and which are delivering a surprising sugar load disguised behind a "whole grain" claim.
Every comparison in these guides was built around real barcode-scan data — the same data ScanShop surfaces when you scan any product yourself. Use the guides as a reference, then bring ScanShop to the store to verify the specific brand or variety you're buying.